Machine Learning for Climate Change Modeling
I built a large-scale, end-to-end data science pipeline to study how long-run climate trends align with agricultural performance across Africa. Rather than focusing on causal claims, the objective was to integrate massive, heterogeneous climate and crop datasets into a unified analytical framework, extract interpretable signals, and surface regions where climate stress and agricultural underperformance increasingly coincide.
The project emphasizes robust data ingestion, large-scale preprocessing, feature engineering across multiple time scales, and ensemble modeling, operating on tens of millions of raw records spanning over a century of climate and production data.
Total data processed (raw):
~8.6M monthly climate observations
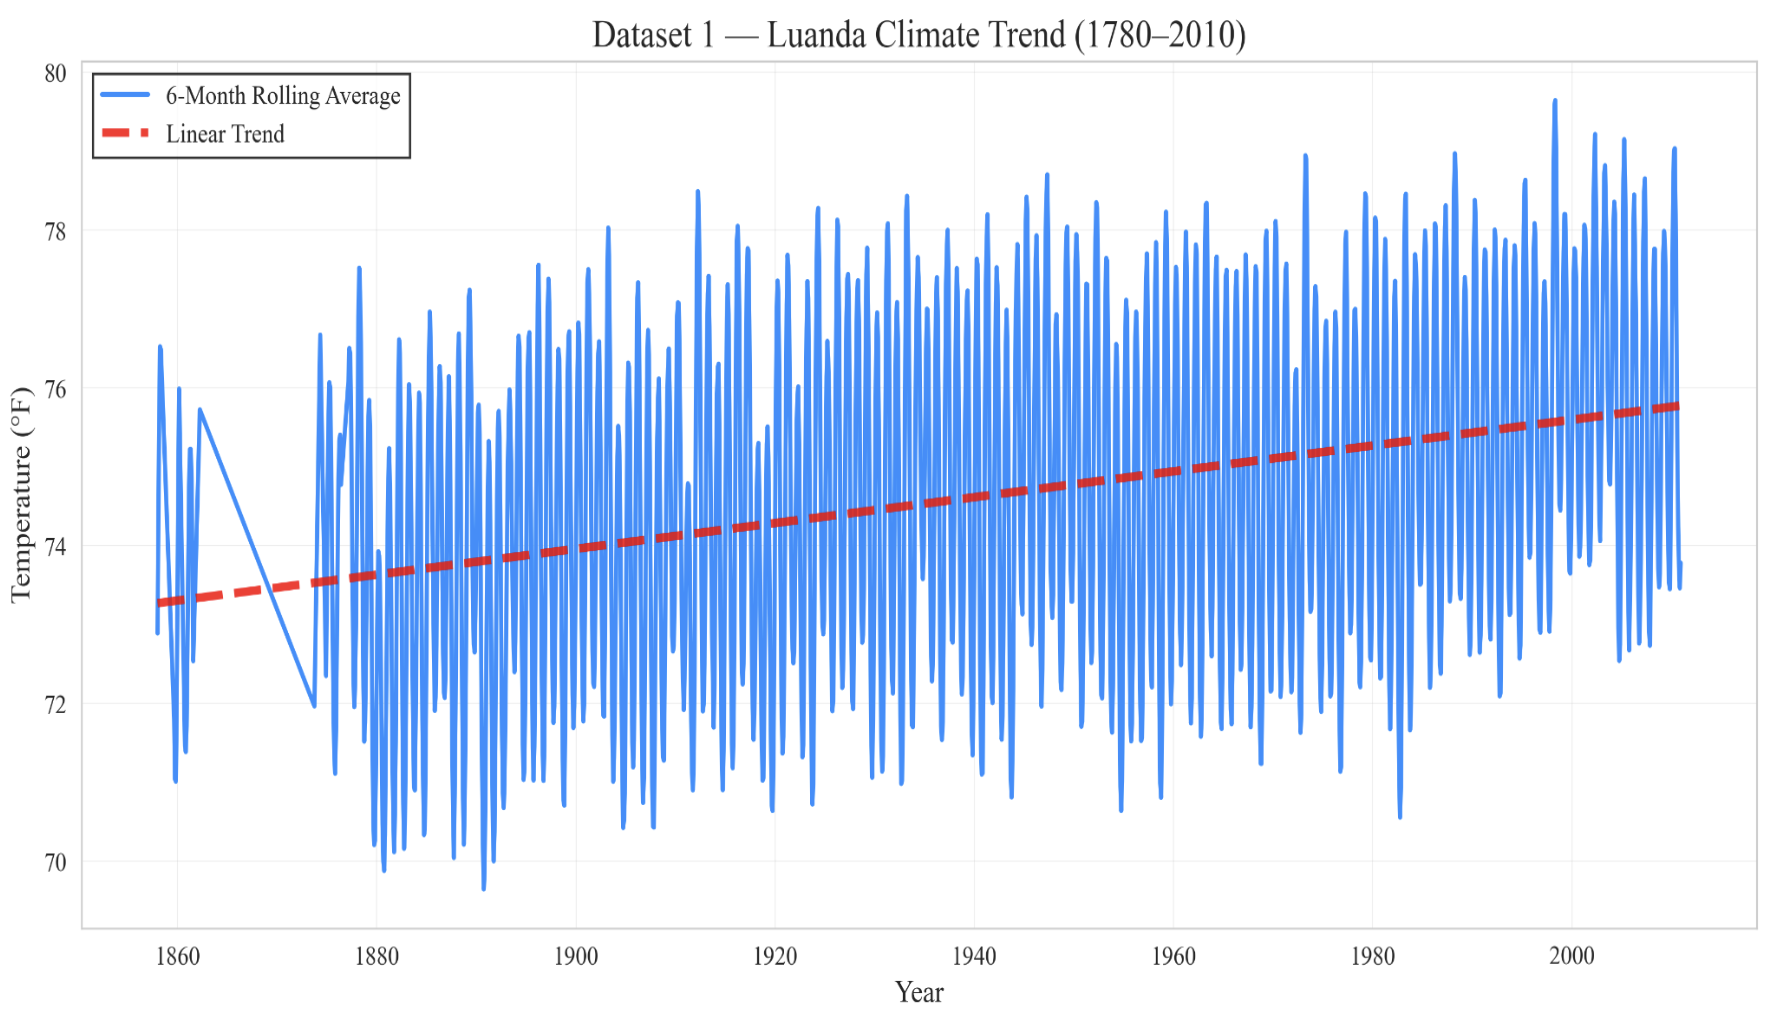
~2.9M daily city-level temperature records
~27.6M daily multivariable weather rows
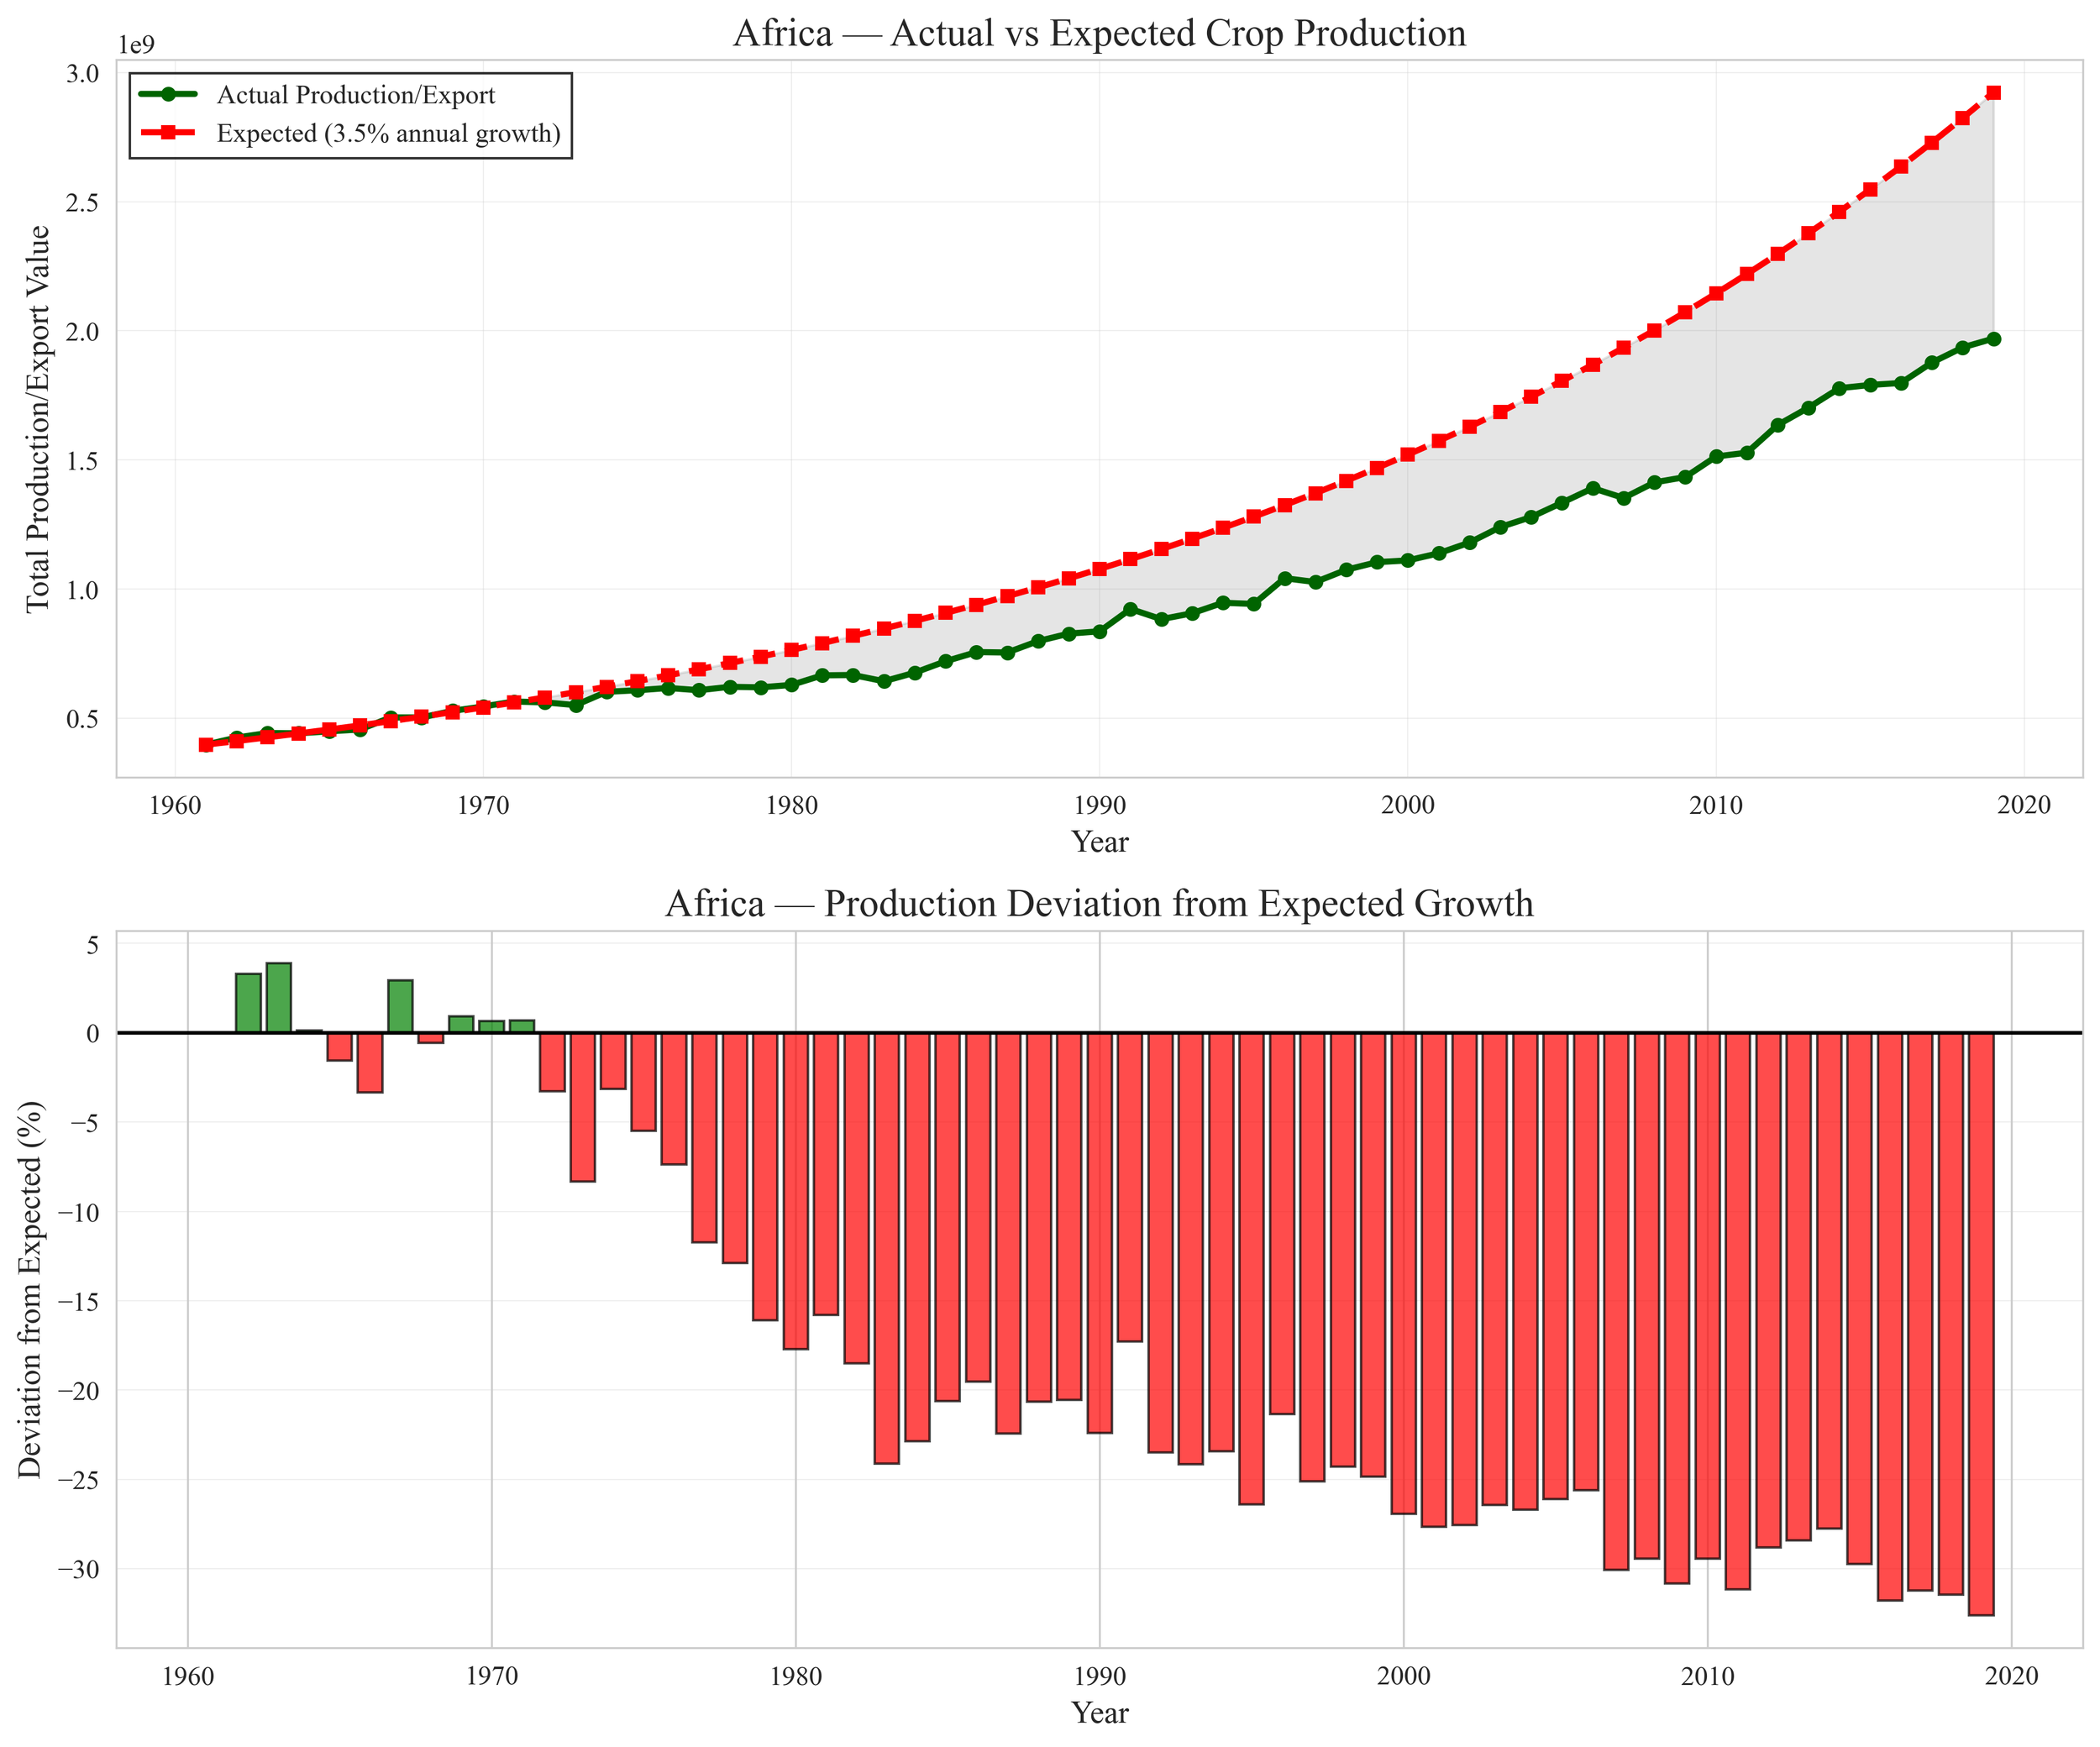
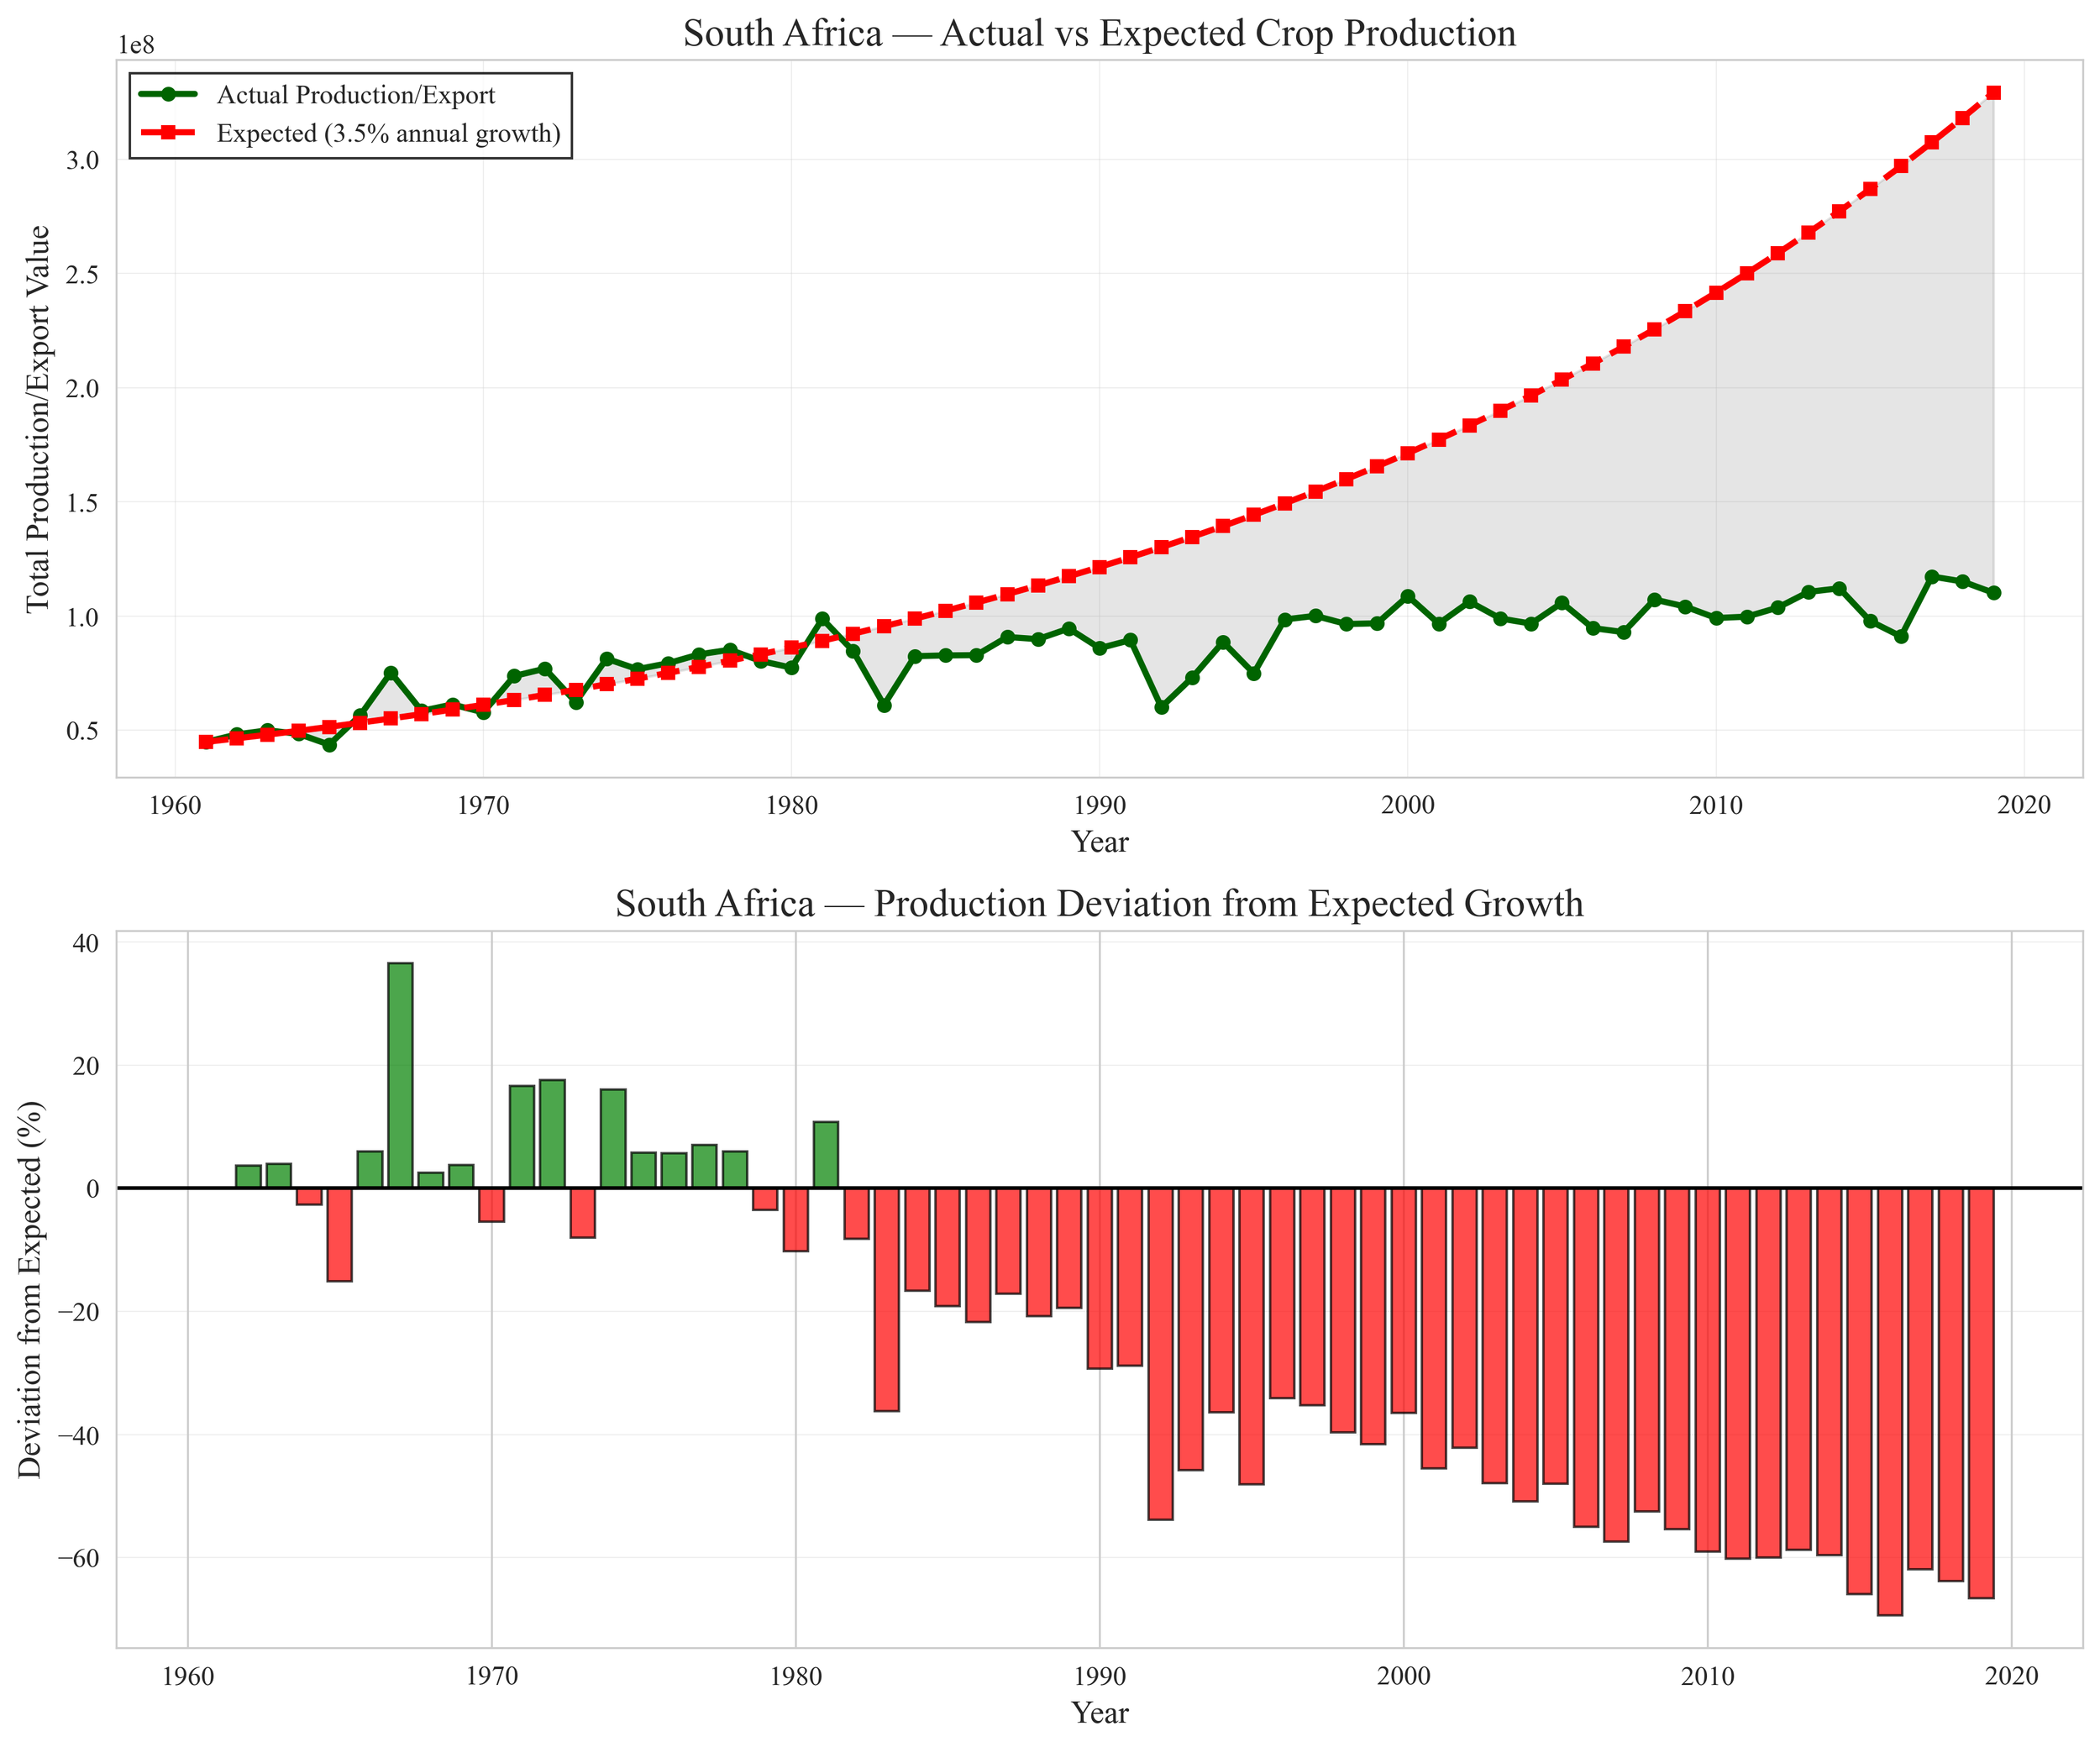
~2.5M agricultural production records
Feature Engineering
Large-Scale Data Ingestion & Cleaning: Designed fault-tolerant loaders and cleaning routines to reliably ingest climate and agricultural data with inconsistent encodings and formats.
Technical highlights:
Automatic fallback encoding handling (UTF-8 → Latin-1) to prevent pipeline failure
Parsing of monthly, daily, and annual time formats into standardized datetime indices
Explicit handling of invalid sentinel values (e.g., −99, “\N”) without silent imputation
Data reduction: Through geographic filtering and normalization, I reduced datasets from >41M rows to ~575K analytically relevant records, while preserving long-run trends.
Geographic Normalization & Dataset Integration: Built a robust city-to-country and region-level mapping system to align city-based climate data with country-level agricultural statistics.
Technical highlights:
Text normalization using accent stripping, casing control, and whitespace trimming
Fuzzy string matching (token-based similarity thresholds) to resolve naming inconsistencies
Explicit city-to-country linkage enabling climate–agriculture joins across scales
Regional grouping (North, West, East, Central, Southern Africa) for comparative analysis
This step enabled cross-scale analysis, allowing urban heat and long-term climate signals to be compared against national agricultural outcomes.
Feature Engineering Across Climate & Agriculture: Converted raw time-series data into interpretable, model-ready features capturing trends, variability, and climate stress.
Technical highlights:
Rolling averages and smoothing windows to isolate long-term temperature signals
Seasonal completeness filters to prevent biased yearly aggregates
Agricultural deviation metrics comparing observed production to expected growth
Climate interaction features linking temperature, rainfall, wind variability, and volatility
Feature groups engineered:
Long-term warming rates
Climate variability and interaction metrics
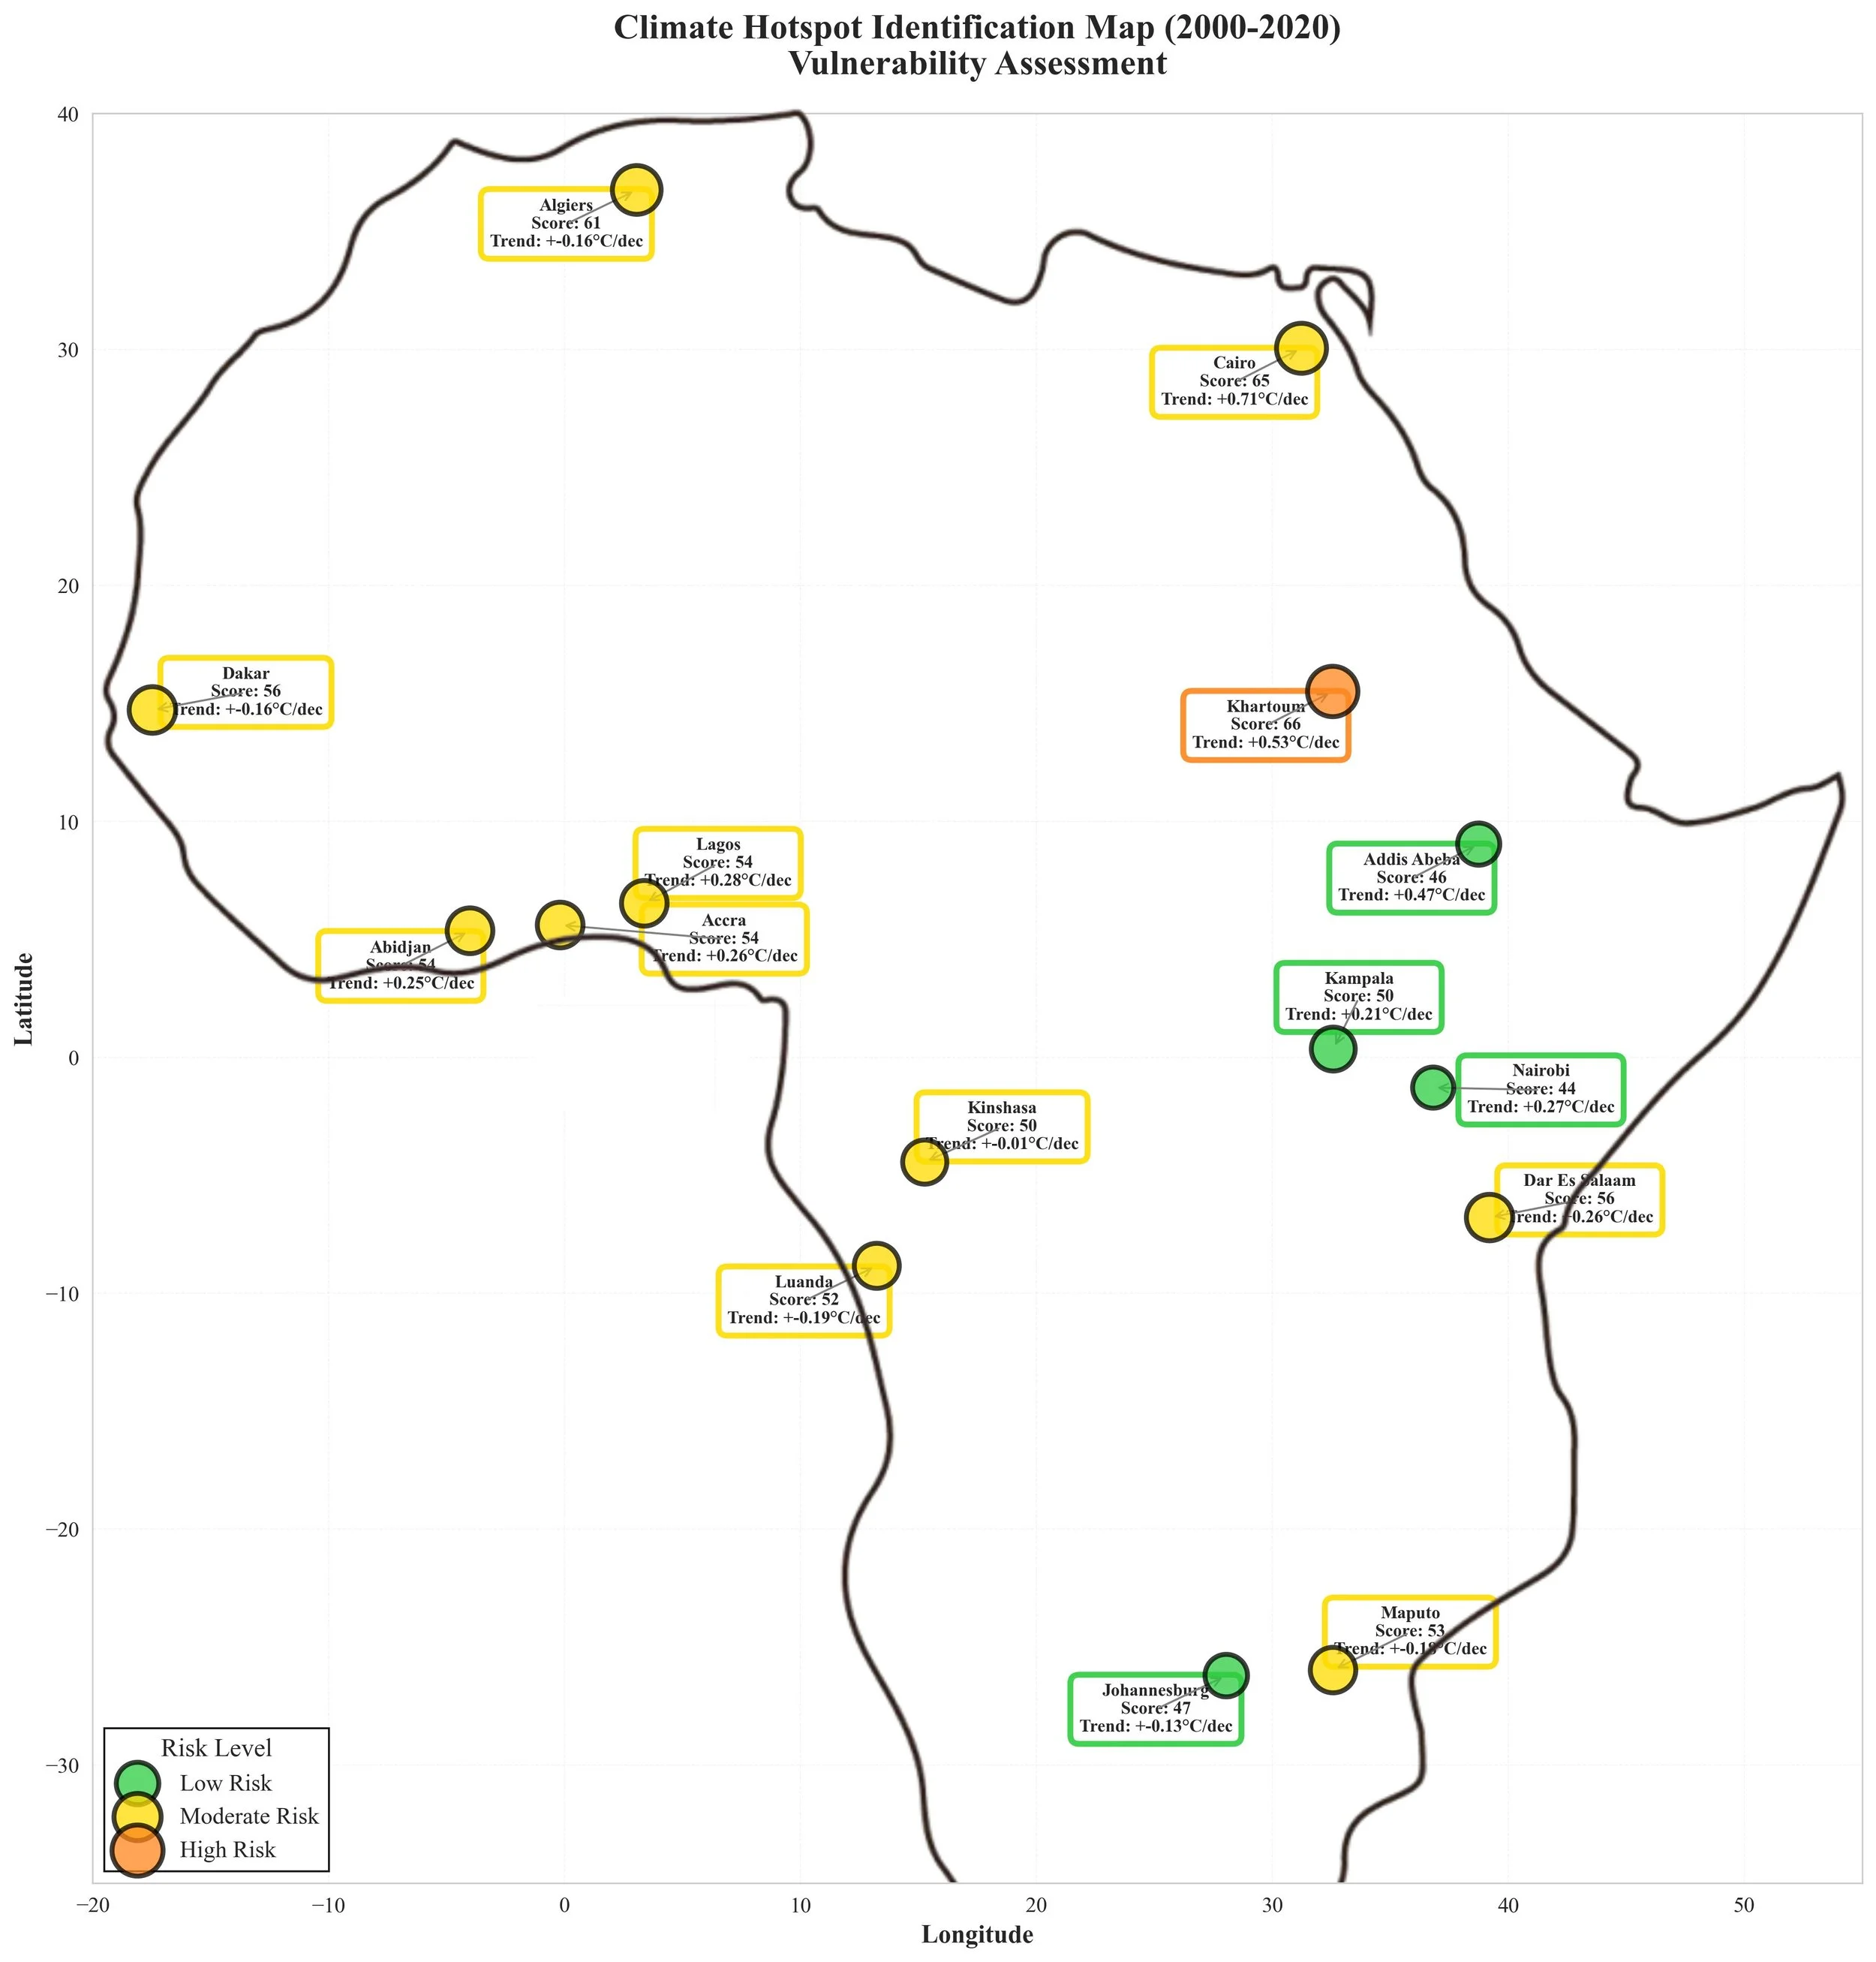
Composite heat vulnerability indicators
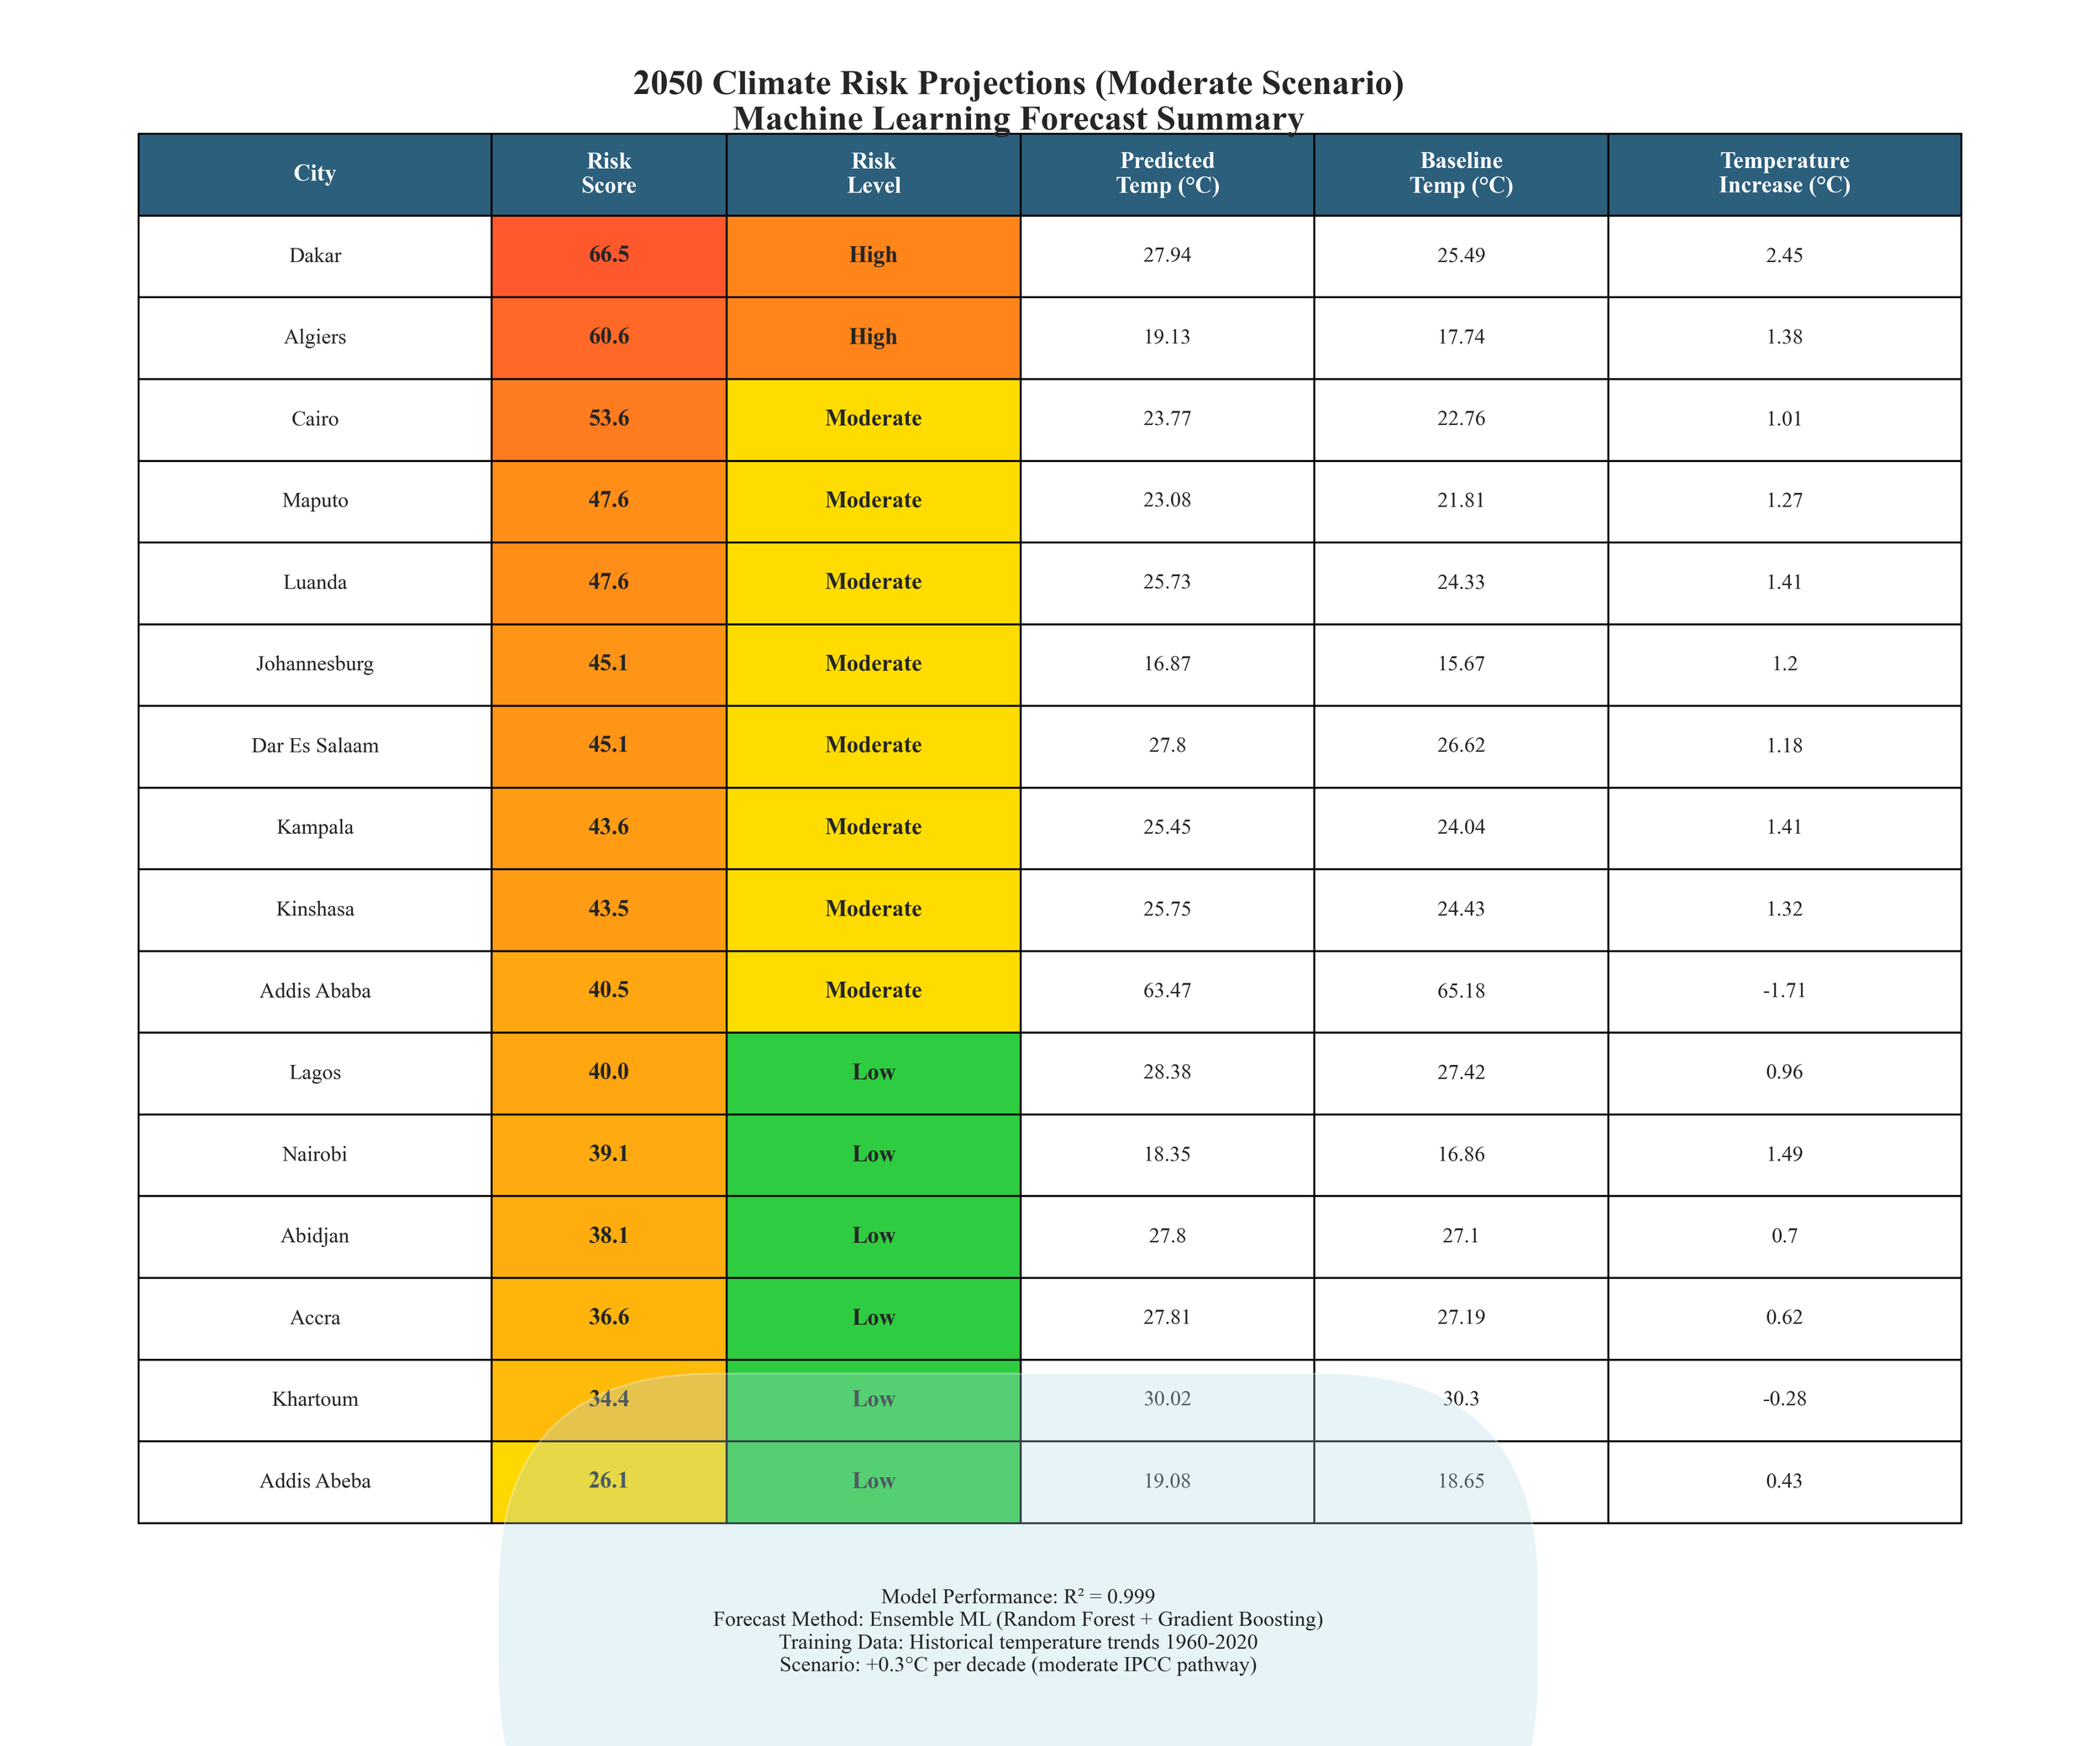
Machine Learning Forecasting & Risk Scoring: Implemented an ensemble learning framework to project future climate risk while maintaining interpretability and uncertainty awareness.
Technical highlights:
Decade-level aggregation to stabilize long-run learning signals
Ensemble of Random Forest and Gradient Boosting regressors
Explicit geographic features (latitude, longitude, distance from equator)
Standardized training pipeline with reproducible splits and scaling
Composite climate risk index combining exposure, warming magnitude, and variability
Scale & output:
Trained on 60+ years of historical climate behavior
Generated 144 future climate risk scenarios across cities, timelines, and pathways
Produced ranked risk tables and spatial vulnerability maps