14kW EV Liquid Cooling Loop
The design and validation of a 14.2 kW liquid cooling system for Columbia’s EV25 race car, featuring dual 95 in² radiators, a diaphragm pump, and MATLAB + CFD informed sizing to manage motor and inverter heat loads under endurance conditions.

-
14.2 kW total heat load from dual Emrax 208 motors and PM100DX inverters during peak operation; design priorities included weight minimization, reliability under vibration and pressure variation, and efficient packaging within tight chassis constraints.
-
Motor and inverter losses estimated using MATLAB-based simulations incorporating drivetrain efficiency maps and vehicle velocity profiles; final steady-state losses calculated as 5.9 kW (motors) + 1.2 kW (inverters) per side, totaling 14.2 kW.
-
Radiator area determined using Effectiveness-NTU method, with Reynolds/Nusselt-based convective coefficients for coolant and air sides; 95 in² radiator area selected to reject 7.1 kW at 5 m/s airflow, supported by a 50+ parameter spreadsheet model.
-
Heat rejection measured via Q = ṁ·cp·(Tin - Tout) at 10.5 L/min flow and 2.2 m/s airflow; benchtop trials confirmed up to 15 kW rejection, exceeding theoretical predictions and validating radiator size and performance under controlled conditions.
-
Closed-loop system with dual radiators in series, Shurflo diaphragm pump, and 3/8" ID nylon tubing; sensor suite includes four thermocouples, one flow sensor, and one pressure sensor; radiator placement optimized using CFD-informed airflow and pressure contours.
Organization
Columbia University Formula SAE
Timeframe
October 2024 - May 2025

Figure 1: OptimumLap simulated engine power to estimate heat load
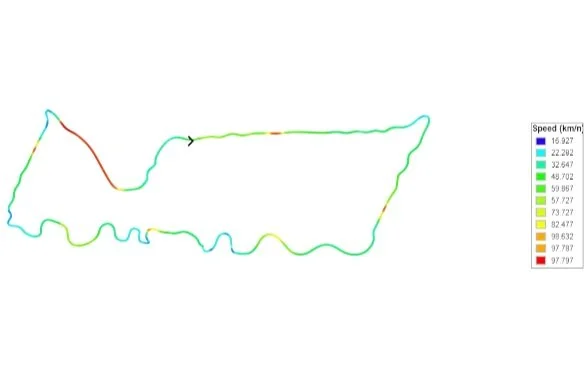
Figure 2: 2019 Michigan Endurance track speed map

Figure 3: (Some) heat transfer equations to quantify heat load

Figure 4: Radiator sizing spreadsheet

Figure 5: Benchtop cooling test setup to validate sizing

Figure 6: Arduino code to read/process sensor data


Figure 7: (Some) CFD to inform placement

Figure 8: Some more CFD

Figure 9: Custom radiator order

Figure 10: Flow diagram of EV25 cooling loop
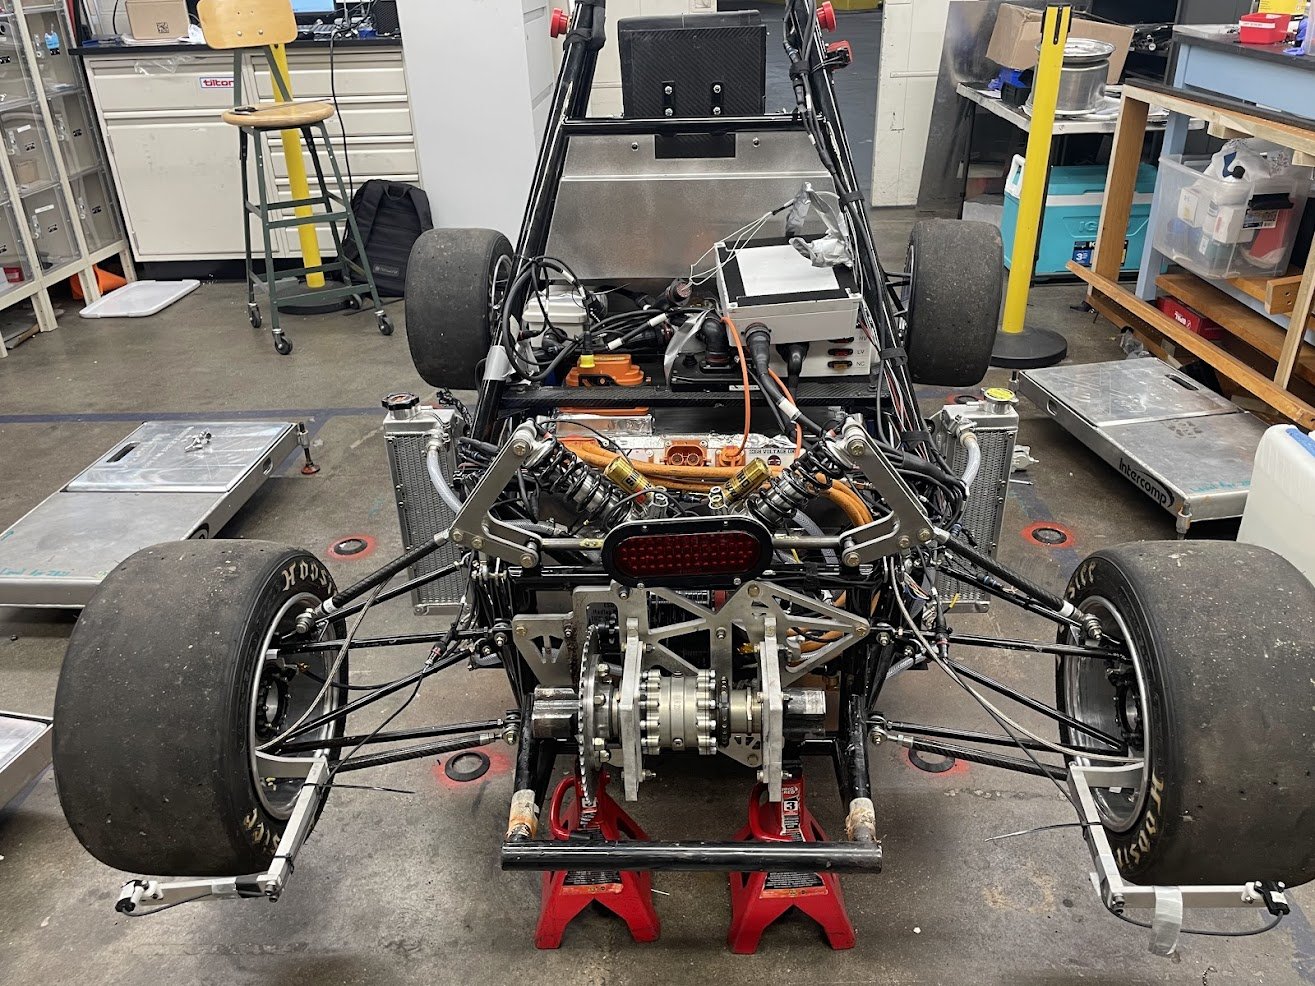
Figure 11: Complete assembly on vehicle (fans removed)

Figure 12: Complete radiator assembly
Skills Utilized
Thermal System Design: Modeling heat generation and dissipation in electric motors, inverters, and coolant loops using thermodynamic principles.
Heat Transfer Analysis: Application of convective heat transfer theory, including Reynolds and Nusselt number calculations, and the Effectiveness-NTU method for radiator sizing.
MATLAB Simulation (Python/C++): Development of custom MATLAB scripts to simulate lap power demands, efficiency-based heat loads, and validate design scenarios.
Computational Fluid Dynamics (CFD): Use of CFD tools to analyze airflow, pressure gradients, and optimize radiator placement within the vehicle’s aerodynamic profile.
Fluid Dynamics: Selection and integration of pumps and tubing based on flow rate, pressure drop, and head loss in closed-loop systems.
Interdisciplinary Collaboration: Coordinating between powertrain, aero, chassis, and electrical teams to align cooling system requirements with broader vehicle constraints.
Design Review Communication: Presenting technical tradeoffs, simulation results, and test data clearly in team meetings and formal design reviews to drive consensus and informed decision-making.
Experimental Validation: Design and execution of benchtop cooling system tests using instrumentation (thermocouples, flow/pressure sensors) and data acquisition systems.
Mechanical Design and Packaging (CAD): Integration of thermal components into a space-constrained chassis, with attention to vibration isolation and accessibility.
System Integration and Testing: Coordination between mechanical, electrical, and aerodynamic subsystems to ensure operational compatibility and endurance reliability.
Data Analysis and Calibration: Interpretation of sensor data for flow, pressure, and temperature under dynamic conditions to validate thermal models.
Design for Manufacturing (DFM): Selection of off-the-shelf components (radiators, fans, pumps) and fabrication of custom mounts, ducts, and tubing with manufacturability in mind.